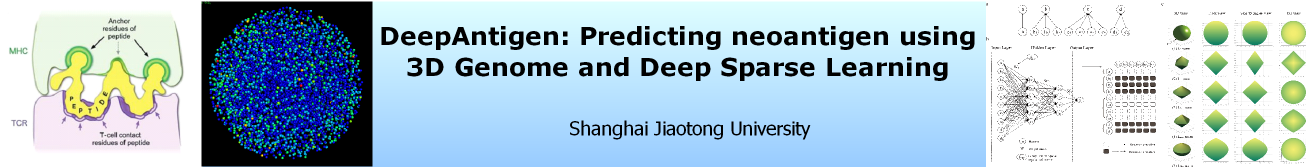
View Variance in 3D Genome
The distribution pattern of the DNA loci of the immuno-positive and immuno-negative peptide on hESC (left) and IMR90 (right) Hi-C data based 3D models. Red and yellow beads are positive ones and green beads are negative ones (red means there are multiple positive ones in that bead), while blue is background.